Python: Amazon Price Scraper
So Christmas is on the horizon and I thought it would be a fun side project / good break from all of the very low level C code to make a price scraper for Amazon. I followed a tutorial by Dev Ed on youtube which you can find here. Now this was a usable program but it had a few issues I wasn’t sure I could live with so I sat out to make this program into something I and others may be more comfortable using. I doubt I will be able to fix all of these problems, I have 0 experience with python, but I will post an extensive list and mark off those that I have fixed thusfar here.
Problems
- The number stored requires knowing ahead of time the number of digits it will contain - see Price Conversion
- The program has no GUI, not an issue for people used to working with a terminal but definitely hurts usability - see GUI
- The program only tracks one product at a time
- The program requires a URL to work, possibly not an issue, but it would be better to have this stored in a variable instead of hard coded into the function
- The program only tracks prices whie running (duh), maybe we can webhost this or at least make it run on computer startup (Rasberry Pi microserver time?)
- If the price of the product does fall to where we want it to, it will send an email every time it checks again (at whatever frequency you have set)
- There is no way to change the price to notify by except changing a conditional within the program, maybe have that set to a variable based off of the original scan.
- There is no storage of the price changes over time, having this functionality may make it clear if an item being watched is holding its value or dropping over time - see Saving Data to Files
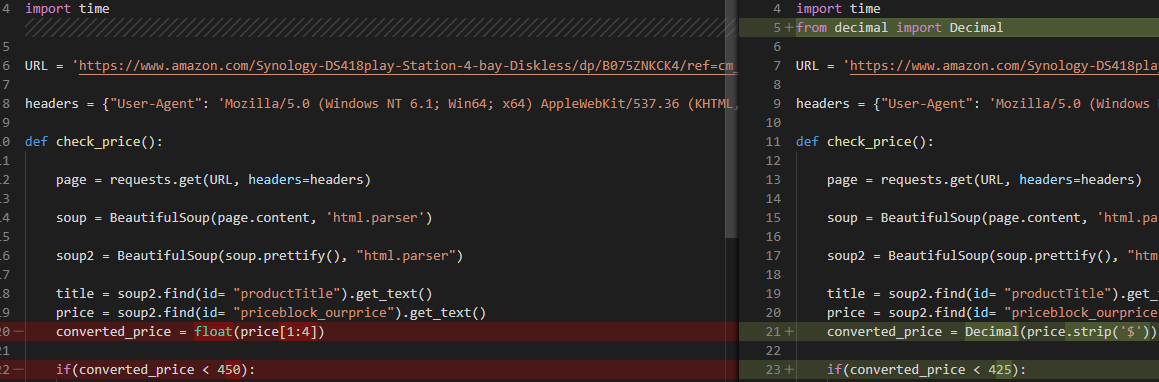
Price Conversion
23 Nov 19: This was actually a very easy fix, we simply imported a decimal supporting library then stripping the dollar symbol from the stored value. The same method can be used to strip other currency symbols as well, and we no longer are storing a set number of digits, so we do not need to modify the progrom for each individual item based on the number of digits in its price moving forward.
Saving Data to Files
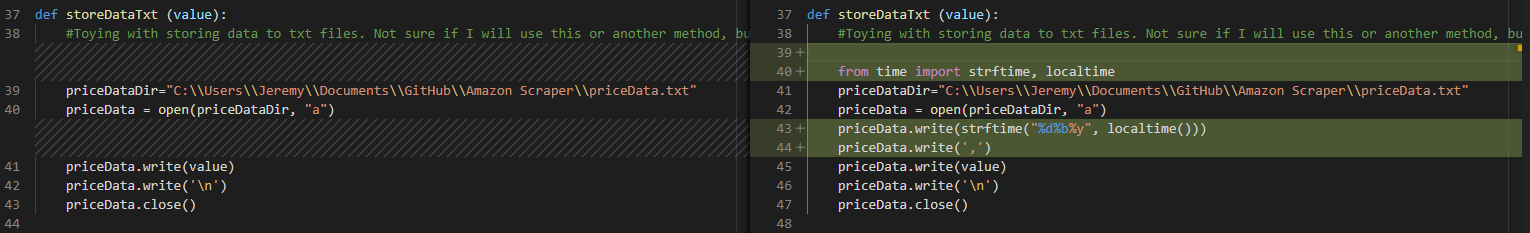
03 Jan 20: My current solution is saving data to a txt file. This is subject to change and still needs some work at this time. Namely, now that I have began with setting up a live graph through matplotlib I realize I need to also store the date and possibly time along with the price in order to properly graph the changes over time. I’ll use the time library and simple concatonation with a comma as my delimmiter and split the data, but have not set this up yet.
05 Jan 20: Storage of values and date to text now fully automated and formatted to be plotted by graphing function. To do this I utilized the time function, converted the current time to a string and saved it to my txt file on the same line as my price value. It may be nice to have the date format itself configurable by the user when this is a finished product.
Graphing Data
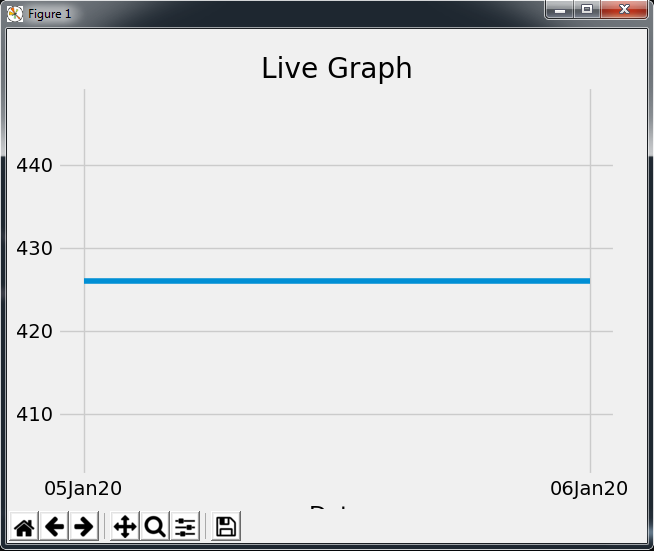
03 Jan 20: I’ve imported matplit lib and am currently digging through its documentation and a few tutorials elsewhere (sentdex on YouTube) in order to try to get this running. As of now I’m displaying a graph but still need to figure out how to properly get my data to display.
04 Jan 20: Data is now showing on graph, the reason it was not working previously was due to how I was storing data to the txt file. Using a different text file with my own inputs it worked without issue. Because I was not storing the date the graph function was looking for a second variable to split and finding only the price. Once I’ve set up my data storage function with the ability to store the date with the price the issue should be permenantly fixed. I also had a few issues with my animate function not being a child function of the graph function, and variable hierchy not being used. By making the graph itself a variable local to the graph function and nesting the animate function which will poll the text document for changes at a set rate (1 second currently) I was able to fix this issue.
def graph():
    style.use('fivethirtyeight')

    fig = plt.figure() #creating a subplot
    ax1=fig.add_subplot(1,1,1)

    def animate(i):

        priceDataDir="C:\\Users\\Jeremy\\Documents\\GitHub\\Amazon Scraper\\priceData.txt"
        data = open(priceDataDir,'r').read()
        lines = data.split('\n')
        xs = []
        ys = []

        for line in lines:
             if len(line) > 1:
                x, y = line.split(',') # Delimiter is comma
                xs.append((x))
                ys.append(float(y))

        ax1.clear()
        ax1.plot(xs,ys)

        plt.xlabel('Date')
        plt.ylabel('Price')
        plt.title('Live Graph')

    ani=animation.FuncAnimation(fig, animate, interval=1000)
    plt.show()
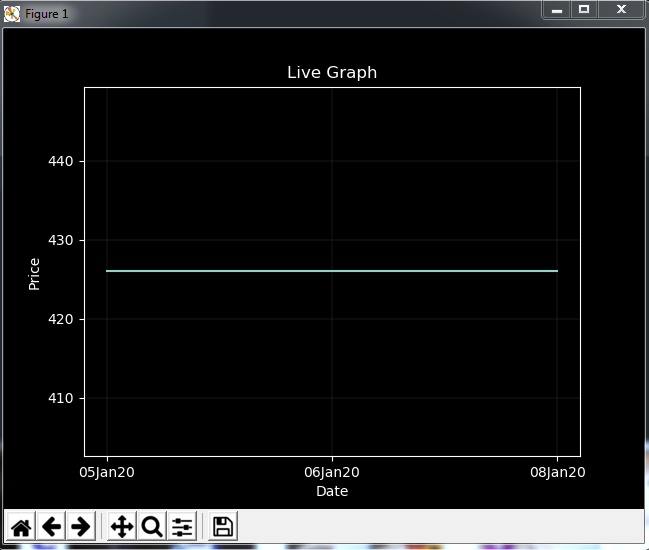
08 Jan 20: Made minor changes to the graph function, using code examples found here I was able to add lines to the graph to make it far more readable. I’m still looking to change the graph title to that of the product it is tracking but if you’ve read the other post I made today, you’ll understand why I’m trying to make minimal calls to Amazon’s website today. I also changed the style of the graph to be more suitable to the GUI’s color pallet.
style.use('dark_background')
ax1.grid(color='grey', linestyle='-', linewidth=0.25, alpha=0.5)
GUI
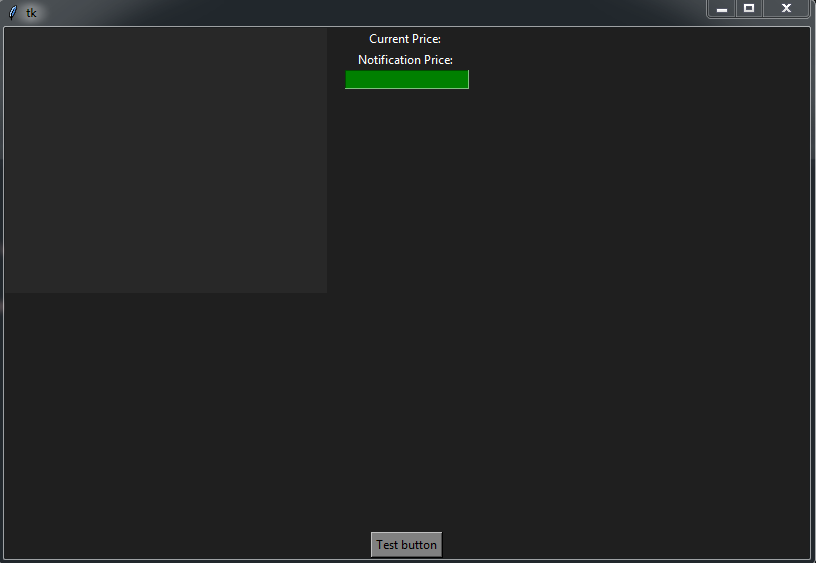
06 Jan 20: Using tkinter I was able to begin working my way to a useable GUI, its pretty awful at this point, and is taking quite a lot of refactoring of the program as whole to get working. Previously I was using the original tutorials janky implementation to run the program with a while(True) statement. From this point I will be working to make the program less autonomous and more GUI oriented. I intend to make how often things are checked configurable as well as a few other options, as well as implement the graph function into the GUI itself if possible, or have it ran on a button press instead of running each time the program is executed.
import tkinter as tk

root = tk.Tk()
cHeight=500
cWidth=800

canvas = tk.Canvas(root, height=cHeight, width=cWidth)
canvas.pack()

frame = tk.Frame(root, bg='#1f1f1f')
frame.place(relwidth=1, relheight=1)

#Frame to hold image label
frameInner = tk.Frame(frame, bg= "#282828")
frameInner.place(anchor='nw', relwidth=.4, relheight=.5)

#Stores command=function_name to run a function
button = tk.Button(root, text="Confirm Change", bg='gray',)
button.pack()

labelPrice = tk.Label(frame, text= "Current Price: ", bg='#1f1f1f', fg='white')
labelPrice.place(relx=.7, rely=0)

labelNotifPrice = tk.Label(frame, text= "Notification Price: ", bg='#1f1f1f', fg='white')
labelNotifPrice.pack()


#Entry pane to change notification price.
entry = tk.Entry(frame, bg='green')
entry.pack()


root.mainloop()
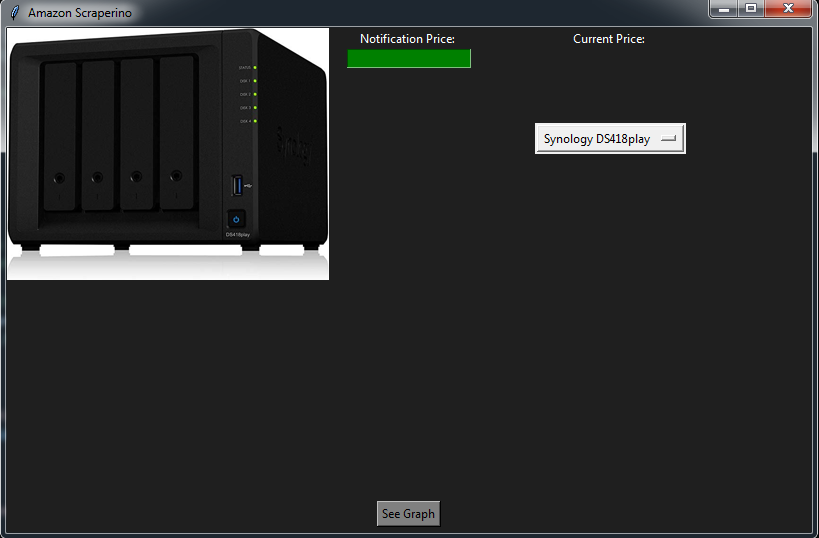
16 Jan 20: Added drop down menu which gets its selectioins from a list, currently working on getting the selections to autopopulate the rest of the GUI with the product name, price, image and graph.
    # List to hold currently indexed products
    productList = [
        'Synology DS418play',
        'Sweet Cell Phone Case',
        'Arduino'
    ]

    # Dropdown for product selection
    var=tk.StringVar()          # Holds current selection
    var.set(productList[0])        # Sets Default Selection

    # Configuring actual drop down position.
    productSel= tk.OptionMenu(frame, var, *productList)     #Configuring actual drop down
    productSel.place(anchor='s', relx=.75, rely=.25)
Added filtering to locate and save the image url of the landing image to a variable in the check_price function. Used requests to download said image to the premade directory.
    # Filtering down to the closs that holds all of the image information
    imgs = soup2.find('div', class_='imgTagWrapper')
    # For debugging print('imgs= ',imgs)


    # Filtering down to the direct product image url.
    imgsurl = imgs.find('img', class_='a-dynamic-image') ['data-a-dynamic-image']
    imgsurl = imgsurl.split('"')
    imgsurl = imgsurl[1]
    print('imgsurl= ',imgsurl)
Hard coded the first image I’ve downloaded to figure out how to properly incorporate it into the GUI, had to add another inport to get image handling working but the image is now fully integrated into the gui and is auto-resizing when the program is stretched/maximized.
 # Frame to hold image label
    frameInner = tk.Frame(frame, bg= "#282828")
    frameInner.place(anchor='nw', relwidth=.4, relheight=.5)

    def resize_image(event):
        new_width = event.width
        new_height = event.height
        image = copy_of_image.resize((new_width, new_height))
        photo = ImageTk.PhotoImage(image)
        labelImage.config(image = photo)
        labelImage.image = photo #avoid garbage collection

    image = Image.open("C:\\Users\\Jeremy\\Documents\\GitHub\\Amazon Scraper\\image.png")
    copy_of_image = image.copy()
    photo = ImageTk.PhotoImage(image)
    labelImage = tk.Label(frameInner, image=photo)
    labelImage.bind('<Configure>', resize_image)
    labelImage.pack()
This is the GUI currently. Obviously lots of work to do still but I’m so happy I got the image handling taken care of finally.
Multiple Product Tracking
09 Jan 20: Its 2am, I started off yesterday just wanting to tackle grabbing the product images from the website so I could implement them into the GUI, but then I realized if I wanted images, I needed a place to store them. If I intend to have the product track multiple products in the future, that would hardly be organized. I decided it was time to implement some type of automated file handling and storage. This is what I came up with.
def setupDir(product):

    if (os.path.isdir('./'+ product) ==False):
        os.mkdir(mainDir + product)
        os.mkdir(mainDir + product + '//' +'productImages')
I added a call to this function to the check_price function for now, which at this stage is the funnel for the entire program working, as data isn’t stored from beautifulsoup elsewhere, it is simply parsed there and the price and product name are taken as variables. This will test if there is a folder with the name of the product as its name, if not it will create one, as well as a second folder within it to hold the images I intend to scrape (still did not get to that today/yesterday, unfortunately). Otherwise it does nothing. I decided it may also be important to store more information on the product, such as the product name itself, a description, and other information I may find useful outside of the graph function. I added a few new lines to the storeDataTxt function to facilitate.
titleDataDir=mainDir + '//' + product + '//' +"productData.txt"
    titleData = open(titleDataDir, "a")
    titleData.write(product)
    titleData.close()
I will be utilizing the os module to check if the productData.txt file already exists, and if it does it will not be overwritten, and will instead proceed to save the date and price as it already did previously, I’m also only saving the name of the product at this time, as this was only for testing, I’ll scrape anything that seems useful to here for safekeeping in the future. As you can see by the time created, everything here, including the folder containing all of this, is automatically generated between the setupDir function and saveDataTxt.
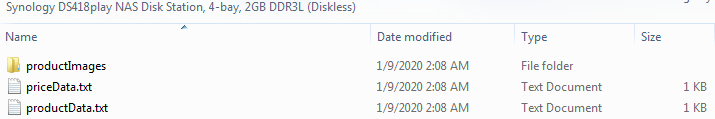
I’m actually pretty happy with my progress for the day all things considered, though I will have to find a new solution to my graphing function moving forward, as it currently has its file path hard coded, I’ll ponder that in the morning before moving on to storing more data and scraping the images. Upon running the program, this is the set of files created.